Your business already has the data. We make it usable for better operating decisions.
We turn scattered operational, financial and customer data into trusted reports, action queues and practical automations, so the team can see what happened, what is missing, what needs fixing and which decisions should not wait.
what is missing, and what to fix first
decision-ready report
using live business data
before the build begins
What you get from the analysis
-
Data map and trust checks
A clear picture of which numbers can be trusted, where they come from, and what needs checking when two systems tell different stories.
Which source should we trust? Do the totals reconcile? Which fields are missing? Where does the logic break? -
Decision-ready views
Visual reports shaped around margin, cash, operations, customers, bottlenecks, exceptions and trends, so the business is readable at a glance.
Which KPIs need a daily view? What changed this week? Which customers need review? Where are exceptions building up? -
Drivers behind the numbers
When a number moves, the report shows what pushed it: pricing, mix, timing, utilization, delays, costs, discounts, missing records or process gaps.
Why did margin move? Which costs are creeping up? What is volume hiding? Which segment is pulling results down? -
Action queues and repeatable workflow
Findings become next steps: invoices to chase, records to fix, customers to review, unusual costs to investigate and reporting work that can become a recurring operating habit.
Which invoices need follow-up? Which jobs need repricing? What should be automated next? What should we fix before the next report?
Automations the work can create
Data workflows
Expected cash in and out: customer payments, supplier bills, payroll and tax dates.
Completed work waiting on invoice, approval, proof, order record or client sign-off.
Missing records, duplicates, stale exports, unusual costs and fields that do not reconcile.
Margin shifts, late work, volume changes, refunds, credits and other outliers.
Process automations
Work waiting on a decision, signature, manager review or client confirmation.
Drafts reminders from data gaps, due dates, missing documents and overdue tasks.
Group invoice, proof, receipts, approvals, notes and next steps in one place.
A report bot summarizes what changed, what is stuck and what needs attention.
Build this from your business data
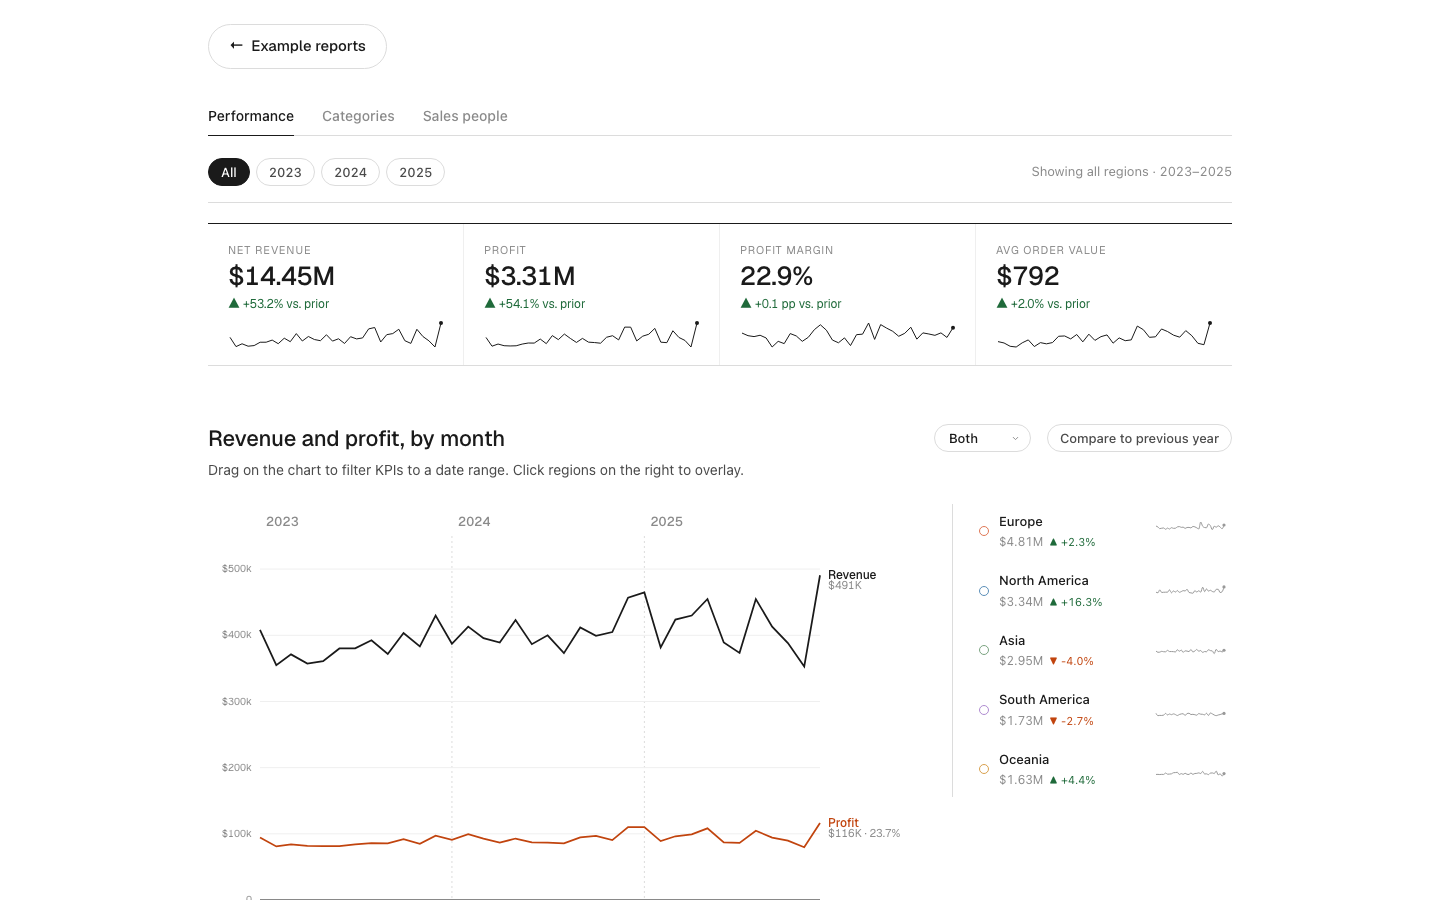
Revenue, margin and sales team
A sales and margin dashboard for category mix, regional performance and sales-team contribution.
- Answers
- Which categories, regions and salespeople are growing revenue without protecting margin.
- Uses
- Sales exports, product lists, customer records, discount files and cost data.
- Your version
- Your customers, products, channels, margin rules and weekly actions.
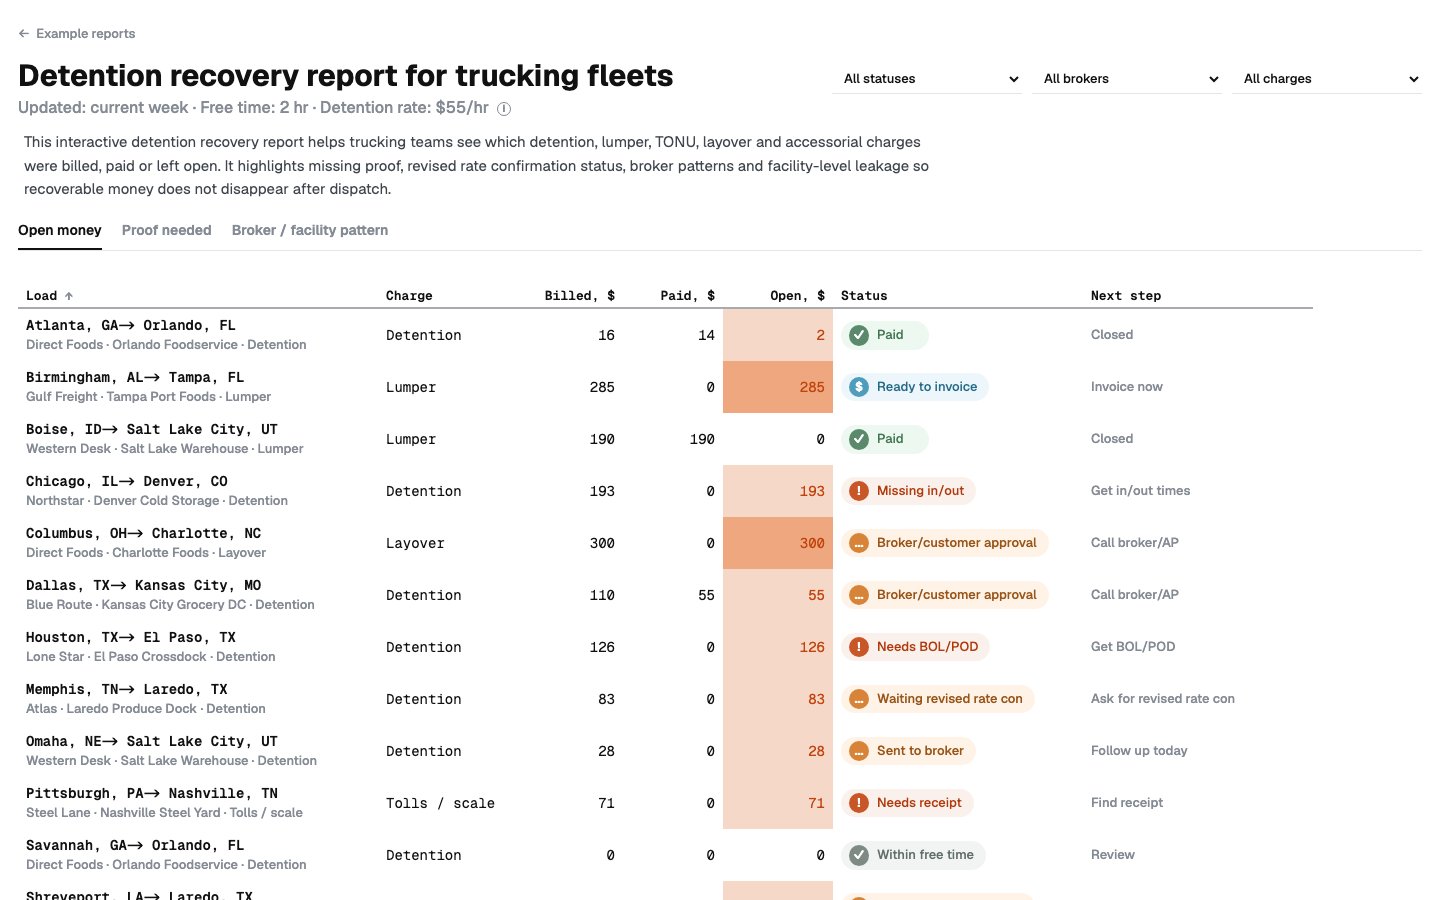
Detention billed is not the same as detention paid
A recovery view for billed, paid and open accessorial money, plus proof needed before collection.
- Answers
- Which accessorial money is billed, unpaid, underpaid or blocked by missing proof.
- Uses
- Rate confirmations, BOL/POD files, invoices, broker payments and notes.
- Your version
- Your brokers, facilities, claim statuses, follow-up owners and collection queue.
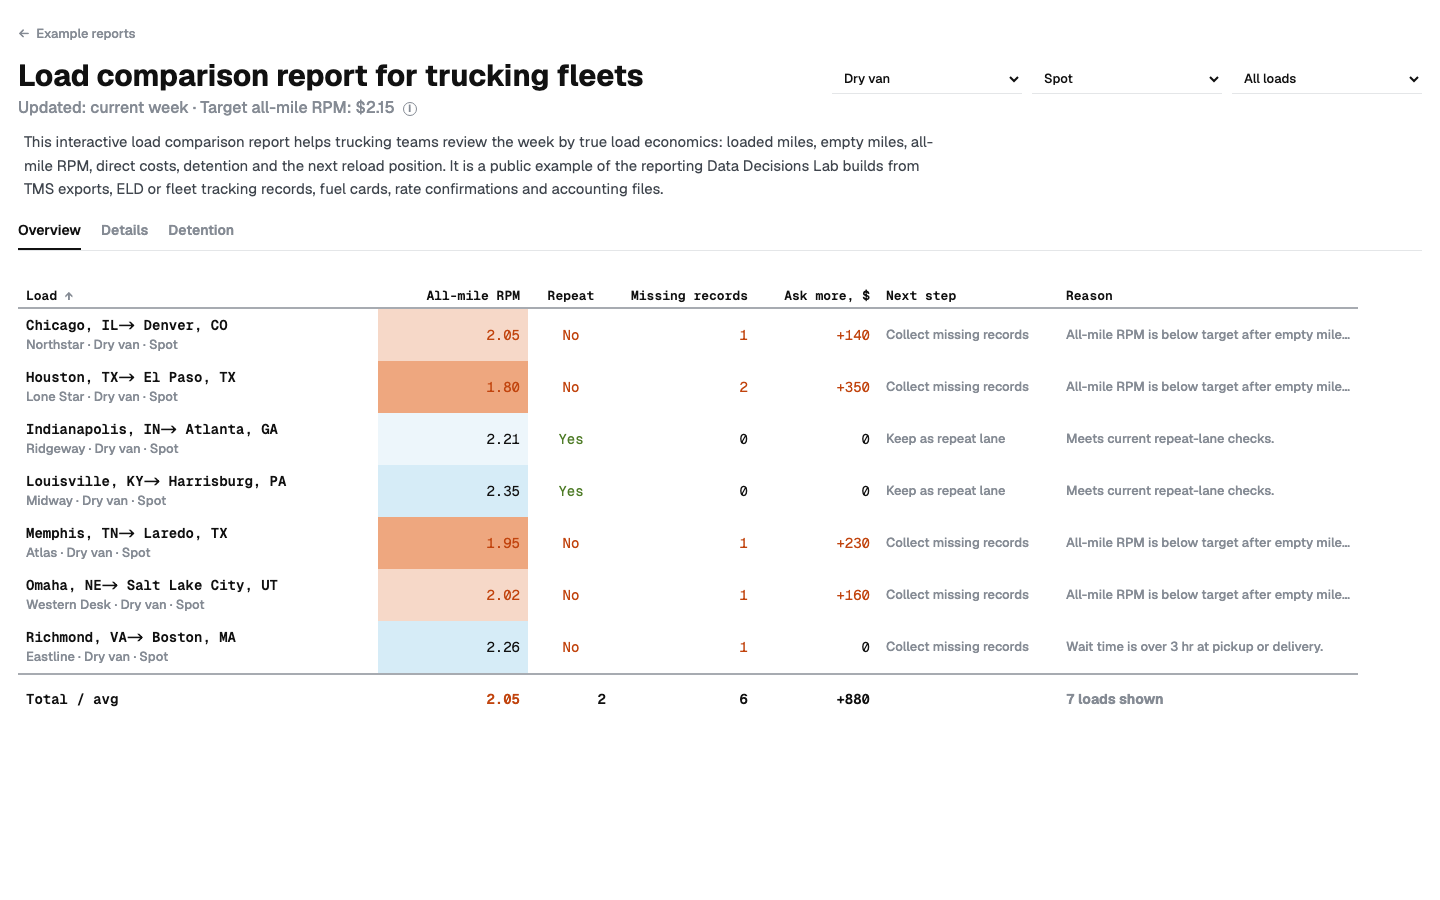
Does the load still work after all miles are counted?
A compact decision list for all-mile RPM, empty miles, wait time, detention and next reload distance.
- Answers
- Which loads keep trucks busy but miss the weekly number after all miles and time are counted.
- Uses
- Load records, dispatch exports, miles, fuel, tolls, detention and reload notes.
- Your version
- Your load rules, cost floor, lanes, truck types and pre-booking review logic.
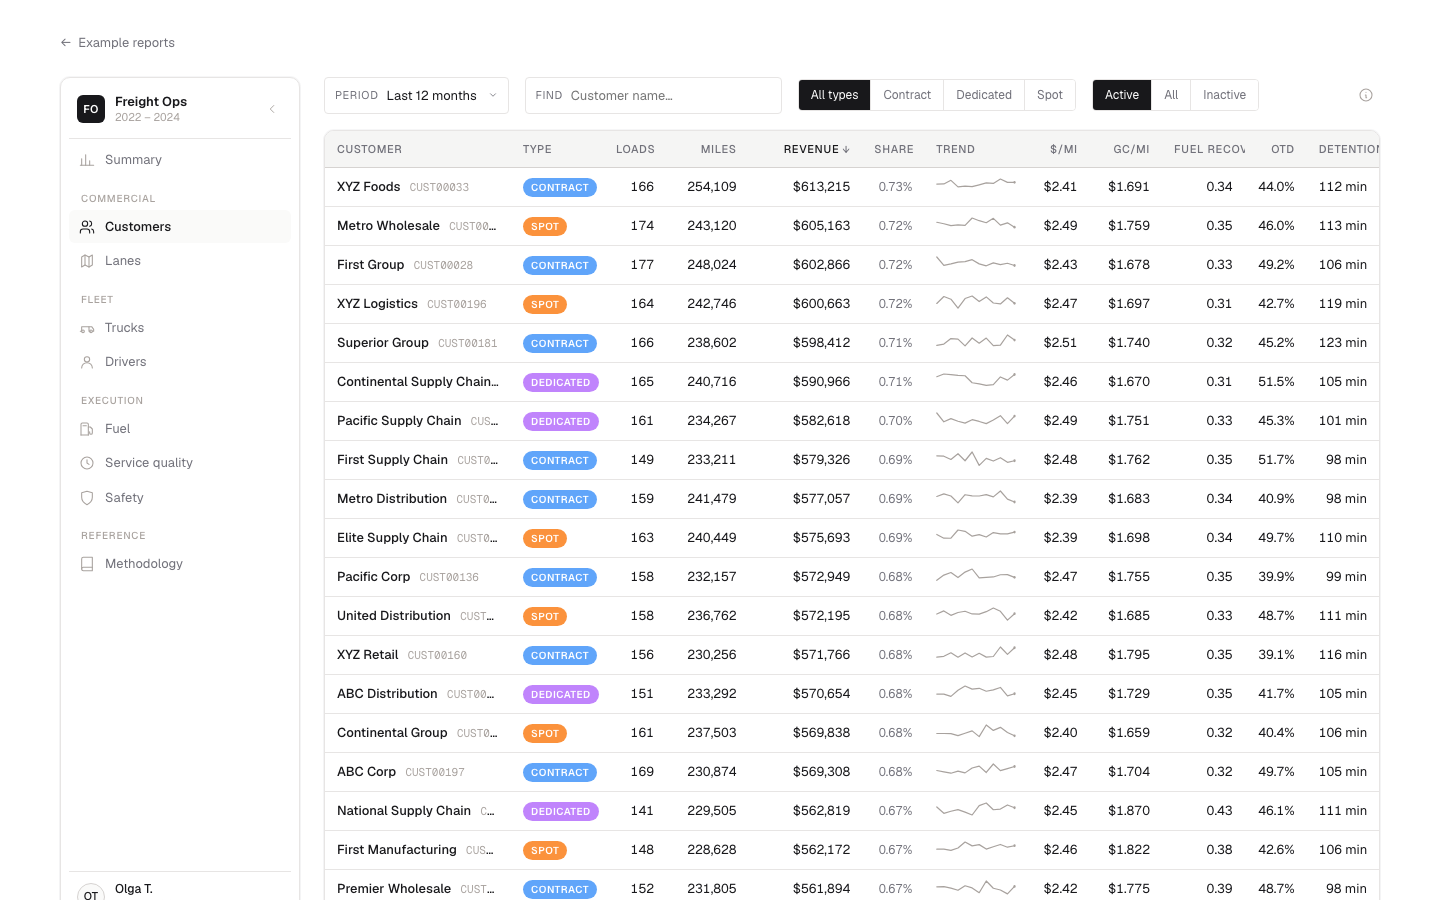
Loads that look good by the mile can still lose the week
A fleet performance dashboard for customer margin, lane economics, fuel, service quality and truck performance.
- Answers
- Which customers, lanes and trucks look productive but lose margin through fuel, delays or downtime.
- Uses
- TMS exports, fuel cards, maintenance records, invoices, driver and truck activity.
- Your version
- Your operating model, customer contracts, fleet costs, service rules and exception list.
Start by mapping the data
Data sources mapped
- Operational systems and exports: dispatch, TMS, CRM, POS, order, job, load or service records.
- Finance records: QuickBooks, Xero, invoices, payments, AR, payroll, vendor bills and cost files.
- Proof and document flows: approvals, receipts, contracts, POD, BOL, rate cons and supporting files.
- Manual workarounds: Excel, CSV, Google Sheets, copy-paste trackers, month-end files and exception logs.
What you know after
- Which metrics can be trusted, which are estimates and which definitions need to be agreed.
- Where systems disagree, why reports do not tie out and which source should win.
- Which dashboards, visual reports and automations can be built from the data you already have.
- What to build first, how long it will take and the fixed quote before build work begins.
How the work happens
-
1
Intro call, 30–40 minutes
The call maps the problem you’re trying to solve and the decisions riding on it, then reviews your data and how things work today. Free, no commitment.
-
2
Data mapping and scope
Your exports are reviewed, the calculations are checked, and the result is the build scope, timeline and proposed metrics, reports or automations.
-
3
Working prototype in 2–3 weeks
A minimal working version is built on your real data. It might be a report, dashboard, cleaned dataset, refresh workflow or small internal tool. The prototype is reviewed together so the right pieces can be kept, added or dropped.
-
4
Final version and handover
The logic is polished, the process is documented and your team is walked through the finished setup. From there you can keep it in-house, or Data Decisions Lab can stay involved when the data changes.
Frequently asked
- What if the data is only in Excel?
- That’s fine and often easier. The spreadsheets are consolidated, checked for reconciliation, and used as the base for the reporting layer.
- How is the work quoted?
- It depends on the agreed build: dashboard, visual report, automation, cleanup workflow or ongoing reporting support. The agreed scope is quoted once the data sources, deliverables, timeline and handover needs are clear.
- Can it be edited later?
- You can always edit the source data. For the logic, refreshes and layout, training can be provided, or Data Decisions Lab can maintain it on a retainer.
- Where can the reporting tool live?
- Wherever suits you: your domain, an internal server, a private link, or just locally on the director’s laptop. Your data doesn’t leave your perimeter unless you want it to.
- Are NDAs available?
- Yes, an NDA can be signed before any data changes hands.
Want to see what your data can clarify first?
Send a few lines about your business, source systems and the decision you want answered. A reply comes within a day with the cleanest place to start.